Eight published sources. One climb. The Col du Galibier from Valloire is one of the most-measured mountains in road cycling, and yet the length figure quoted for it swings by nearly two kilometres depending on where you look. The average gradient shifts with it. The maximum gradient — the number riders actually fear — spreads across a range wide enough to change how a person paces the final four kilometres. We ran the ascent against OpenTopoData's SRTM 30m elevation model and put our profile next to the road-book figures. This is what we found, term by term.
The Number Everyone Quotes
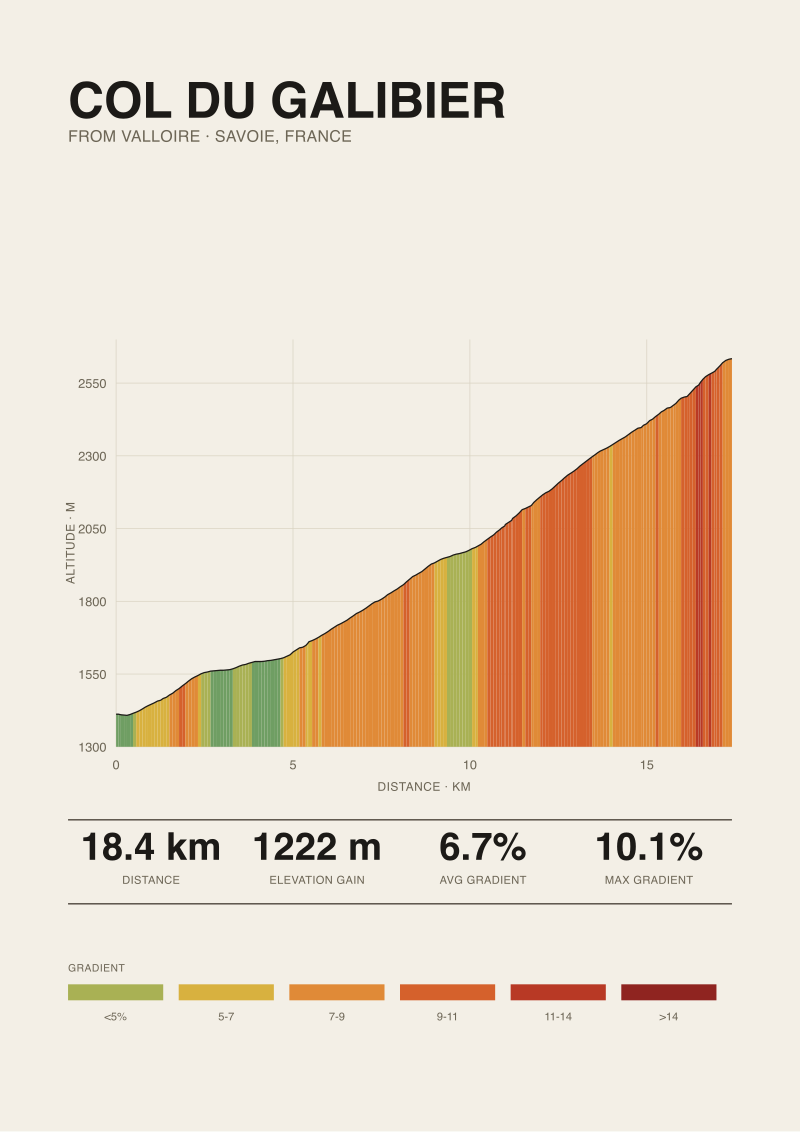
Type "Col du Galibier length Valloire" into a search bar and the returned figures cluster loosely around eighteen kilometres, plus or minus. That "plus or minus" is the whole story. When a climb is quoted at 17 km by one source and 18.5 km by another, the reader assumes rounding. It is not rounding. The two figures describe two different climbs, because their authors drew the start line in two different places. Our baseline, measured against OpenTopoData's SRTM 30m elevation model, is 18.37 km with 1,222 metres of gain from Valloire at 1,412 m to the summit at 2,634 m. We will spend the rest of this article defending each of those digits and explaining where other sources part company with them. None of this is pedantry. On a climb where the last four kilometres punish anyone who arrived tired, a 2 km error in the length figure is the difference between a paced ride and a bad afternoon.
What "From Valloire" Actually Means
"From Valloire" is not a coordinate. It is a village of roughly a thousand permanent residents strung along the D902 for about a kilometre and a half. Where in that string a climb "starts" is a decision, not a fact. Some road books anchor the start at the church in the centre of the village. Others use the last roundabout, where the road pitches perceptibly upward. Others use the northern edge, where the speed-limit sign changes from 50 to 90. Our profile begins at 1,412 m elevation, which corresponds to the upper end of Valloire proper, where the gradient becomes continuously positive and the road commits to climbing rather than undulating along the valley floor. This is the most defensible starting point because it is the first place where a rider's power meter would register a sustained climbing effort. Move the start 800 metres downhill into the village centre and you add roughly a kilometre of near-flat riding at 2 to 3 per cent. The climb becomes "longer" and "less steep" — the same mountain, different arithmetic.
 Col du Galibier
The print from this article · from €29.95
View the print →
Col du Galibier
The print from this article · from €29.95
View the print →
Length: The 18.37 km Baseline
We measured 18.37 kilometres from Valloire to the summit at 2,634 m. This distance was extracted by sampling the road's ground-projected path at 30-metre horizontal resolution using SRTM elevation data, then summing the geodesic segment lengths. The figure is not slope-corrected in a way that materially changes it — at an average gradient below 7 per cent, the difference between ground distance and slope distance is on the order of 30 metres over 18 km, which disappears into rounding. Published sources for the same ascent tend to land between 17 and 19 kilometres. The spread is almost entirely explained by two variables: where the author placed the start line in Valloire, and whether the author used odometer data (which accumulates errors on switchbacks) versus mapped-road data (which does not). Neither method is wrong. They answer different questions. Ours answers: how long is the continuously climbing section of road between the upper edge of the village and the summit sign. 18.37 km. That is the number we would defend in a room of surveyors.
Elevation Gain: Where Sources Diverge
Elevation gain is where the arithmetic gets interesting. Our profile shows 1,222 metres of gain, from 1,412 m at the start to 2,634 m at the summit — a clean subtraction with no false flats or descending sections large enough to add "phantom" metres. Sources that quote higher gain figures for this ascent are typically doing one of two things. Either they anchored the start lower down (extending the climb toward Saint-Michel-de-Maurienne, which is a different route entirely, or into the lower reaches of Valloire, which adds gentle metres), or they are summing gross ascent from a GPS trace that logged noise as small climbs. A GPS device with a barometric altimeter sampling every second on a windy day can easily manufacture 40 to 60 metres of spurious gain on an 18 km climb. Our figure is the summit-minus-start difference, which is the honest way to state elevation gain when the road is monotonically climbing. 1,222 m. No accumulation, no correction, no phantom metres.
Average Gradient: The Arithmetic Trap
Average gradient is the most misleading number in cycling. Ours is 6.7 per cent — 1,222 divided by 18,370, expressed as a percentage. The arithmetic is correct. The intuition it produces is not. A rider reading "6.7% average" and preparing for the Galibier will pace themselves for a steady, slightly-easier-than-seven-per-cent effort. The actual road does not behave that way. The first ten kilometres out of Valloire sit closer to 6 per cent with several sections dropping to 4 or 5. This means the remaining eight kilometres to the summit must average significantly more than 7 per cent to hit the overall figure of 6.7. In practice, the final four kilometres above the Plan Lachat hairpin sustain long sections around 8 to 9 per cent at altitude above 2,300 m, where the air is 20 per cent thinner than at Valloire. The average gradient tells you nothing about that. It is a legally correct number that is operationally useless. This is why our profile prints show the entire gradient curve, not just the mean — the mean flatters the climb.
Maximum Gradient: The 10.1% Question
Climbfinder publishes the maximum gradient for the Galibier from Valloire at 10.1 per cent. This is the highest single-source published figure we treat as authoritative — it comes from a site that measures rather than repeats. Other sources quote maximums ranging from around 9 per cent to over 12, and the spread is not because the road is changing. It is because "maximum gradient" is defined differently by every publisher. Some report the peak of a 100-metre averaging window. Some report a 500-metre window. Some report the steepest single point extracted from raw elevation samples, which on satellite data will always be higher than any sustained gradient a rider actually experiences. The 10.1 per cent figure most likely refers to a sustained short section — probably in the final ramp above the Plan Lachat switchbacks, where the road pitches up on the approach to the false summit. A rider planning around "the Galibier hits 12 per cent" will over-gear and blow up. A rider planning around 10.1 per cent sustained will find their pacing broadly correct. The gap between those two decisions is the gap between finishing and cracking.
Satellite Data vs Road Books
Our profile comes from OpenTopoData's SRTM 30m dataset — Shuttle Radar Topography Mission elevation samples at 30-metre horizontal resolution, gathered by a NASA radar mapping mission in 2000. It measures the terrain surface, not the road surface. On a mountain road with tunnels, overhanging rock, or roadside trees, SRTM can be off by several metres in elevation on any single sample. Averaged across an 18 km climb it converges on the truth to within a metre or two of total gain, but instantaneous gradient at any specific hairpin can be noisier than reality. Road books, by contrast, are typically produced from surveyed road-engineering data: the actual asphalt profile as designed and built. They are precise about the road but often coarse about how far apart their sample points are, which is why maximum gradient figures diverge so widely. Neither source is wrong. Satellite data is honest about the mountain. Road books are honest about the road. When we build a print, we use the satellite profile because it captures the shape of the climb as a geographic object — the shape a rider actually rides. When we quote a peak percentage, we defer to the road book because that number was measured with a rolling wheel, not a radar beam.
What the Rider Should Take Away
The Galibier from Valloire is 18.37 km at 6.7 per cent average with 1,222 m of gain and a published maximum of 10.1 per cent. Those are our numbers. If you find a source quoting 17.5 km at 7.0 per cent, they started higher up in the village. If you find a source quoting 19 km at 6.4 per cent, they started lower. If you find a source quoting a 12 per cent maximum, they extracted a single spike from noisy data and reported it as a sustained pitch. None of these sources are lying. They are answering slightly different questions. The reader's job is to know which question the number answers before pacing a ride around it. Our profile — and the print we made from it, available in the shop — treats the climb as one continuous object measured on one consistent basis. If you want to see where the mean gradient flatters the final four kilometres, look at the shape, not the number.
FAQ
Why do published lengths for Col du Galibier from Valloire vary by nearly two kilometres?
The variance comes almost entirely from where the author placed the start line in the village. Valloire stretches for roughly a kilometre and a half along the D902, and different sources anchor the climb at the church, the last roundabout, or the northern speed-limit sign. Our figure of 18.37 km starts at 1,412 m elevation, where the gradient becomes continuously positive. Move the start 800 metres downhill and the climb becomes "longer" by that amount without a single metre of road changing.
Is the 6.7% average gradient a useful pacing number for the climb?
Not on its own. 6.7 per cent is arithmetically correct — 1,222 metres of gain over 18.37 km — but the road is not evenly distributed around that mean. The first ten kilometres sit closer to 6 per cent with easier sections; the last eight climb harder to compensate. A rider pacing for a steady 6.7 will find the final four kilometres above Plan Lachat significantly steeper than the average implies. The mean flatters this climb.
What does OpenTopoData SRTM 30m actually measure?
SRTM 30m is a global elevation dataset produced from a NASA radar mission that surveyed the Earth's surface at 30-metre horizontal resolution. It records the elevation of the terrain, not the road specifically. Averaged across an 18 km climb it produces a reliable total-gain figure — within a metre or two of the truth — but individual samples at any specific hairpin can be noisier than a road-engineered survey would show. It captures the shape of a mountain honestly.
Why do maximum gradient figures for the Galibier range from 9% to over 12%?
Because "maximum gradient" is not a standardised measurement. Some publishers report the steepest 100-metre averaging window, some use 500 metres, some extract the steepest single elevation-model sample. The 10.1 per cent figure from climbfinder most likely refers to a sustained short section rather than an instantaneous spike. Higher figures usually come from raw satellite samples, which will always exceed any gradient a rider can actually sustain on the road.
Which starting point produces the 18.37 km figure specifically?
We start at 1,412 m, which corresponds to the upper edge of Valloire proper — the point where the road commits to climbing continuously rather than undulating along the valley floor. This is the first place where a rider's power meter would register a sustained climbing effort. It is the most defensible starting point because it aligns with what riders experience as "the climb starting" rather than an administrative boundary of the village.
How much elevation gain is there and why do some sources report more?
There is 1,222 metres of gain — the summit at 2,634 m minus the start at 1,412 m. Sources reporting higher figures are typically either summing gross ascent from a noisy GPS trace (which can manufacture 40 to 60 spurious metres on an 18 km climb) or anchoring the start further downhill. Our figure uses summit-minus-start, which is the correct method when the road climbs monotonically without significant descending sections.
Should riders trust satellite-derived profiles or road-book figures more?
They answer different questions. Satellite data is honest about the mountain as a geographic object — the shape the rider actually rides. Road books are honest about the road as an engineered surface, and their peak-gradient figures are more reliable because they come from rolling-wheel surveys. We use satellite profiles to draw the climb and defer to road books when quoting the maximum sustained gradient. Neither source contradicts the other when read correctly.
Does the difference between road-book and satellite figures matter for pacing?
For the length and average, no — the differences are small enough to disappear into the noise of any real ride. For the maximum, yes. A rider pacing around "the Galibier hits 12 per cent" will over-gear and struggle. A rider pacing around 10.1 per cent sustained will find the final ramp above Plan Lachat matches expectation. The gap between those two decisions is where the climb rewards or punishes preparation.
From the collection
New climbs and 10% off your first print.
One email now with your code. No noise after.