Four climbs. 84.09 kilometres of road. 6,186 metres of vertical gain. That is what actually goes on the wall when you frame the Stelvio, Ventoux, Tourmalet and Gavia together — measured from Prato allo Stelvio, Bédoin, Luz-Saint-Sauveur and Ponte di Legno respectively, on OpenTopoData SRTM 30m elevation. Most cycling wall art sold as "iconic climbs" is decorative silhouette with no relationship to the road. We measure the profile before we draw the print, which means we can tell you which of these four belongs above a turbo trainer and which is a print you buy because you have ridden it, not because it looks dramatic on a shop page.
Methodology: What We Measured Before We Drew Anything
Every profile in this audit was built from OpenTopoData's SRTM 30-metre elevation model, sampled along the road line of each canonical ascent: Prato allo Stelvio for the Stelvio, Bédoin for Ventoux, Luz-Saint-Sauveur for the Tourmalet, and Ponte di Legno for the Gavia. The measured length is the road distance from the recognised base to the summit signpost, not GPS-tracked Strava averages, which fold in warm-up kilometres and traffic detours. Elevation gain is the cumulative positive delta along the sampled polyline, not summit-minus-base — those numbers are equal on continuously rising roads, which these four broadly are, but the sampling method matters when a road has a false flat or short dip.
We record two maximum-gradient figures separately. Our own peak from SRTM 30m tends to under-read the sharpest ramps because 30-metre horizontal resolution smooths short pitches. Alongside it we cite the maximum published in road-book sources — in every case here, climbfinder.com — so a reader who wants the number their power meter will see gets the road-book figure, and a reader who wants the print's honest slope profile gets ours. When the two disagree materially, we say so rather than picking whichever flatters the print. That is the entire method. There is no proprietary algorithm, no "AI-enhanced" anything.
Finding #1: The Stelvio Earns Wall Space on Vertical Gain Alone
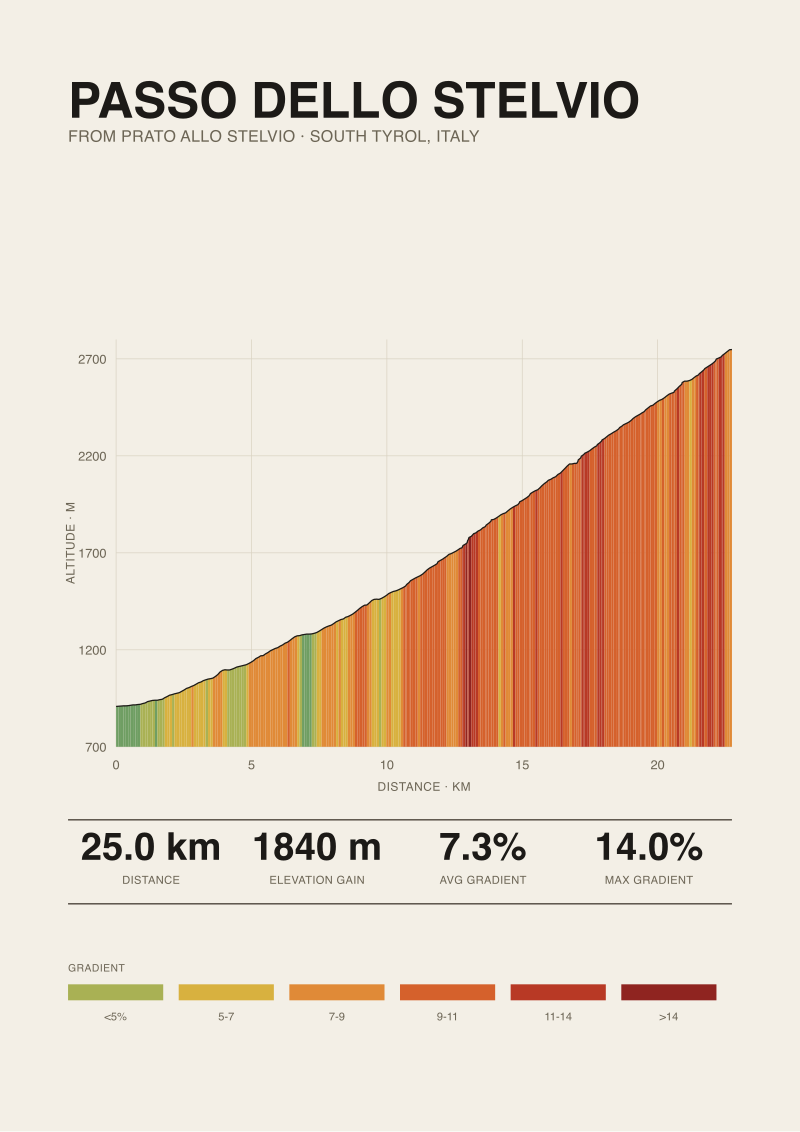
The Stelvio from Prato allo Stelvio climbs 1,840 metres over 25.04 kilometres at an average gradient of 7.3 percent. Start elevation is 908 metres. Summit is 2,748 metres. Those are our measured numbers, and they are the reason this print survives every editorial cull we run for a home gym wall.
The case is arithmetic. On a wall behind a turbo trainer, a print has roughly two seconds of attention per session before the rider clips in. It needs to communicate its own scale without a caption. The Stelvio's 1,840 metres of gain, drawn to a consistent vertical scale, occupies visibly more paper than any other paved climb in this set — 265 metres more than Ventoux, 435 more than the Tourmalet, 474 more than the Gavia. That gap is not aesthetic preference; it is what the elevation delta produces when you plot at true ratio.
The 7.3 percent average is deceptive in the friendliest possible direction. The climb is famous for its 48 numbered hairpins on the Prato side, which means the road is engineered to hold gradient inside a narrow band. Climbfinder puts the maximum at 14 percent. Our SRTM sample under-reads that, as expected. A print that shows the hairpin stack accurately — the constant repetition of switchbacks tightening as the road climbs — is doing work the silhouette cannot. Anything sold as "Stelvio" that shows a smooth curve rising left-to-right has ignored the road. That is the difference between a poster and a profile.
 Passo dello Stelvio
The print from this article · from €29.95
View the print →
Passo dello Stelvio
The print from this article · from €29.95
View the print →
Finding #2: Ventoux Is a Print About Where the Trees Stop
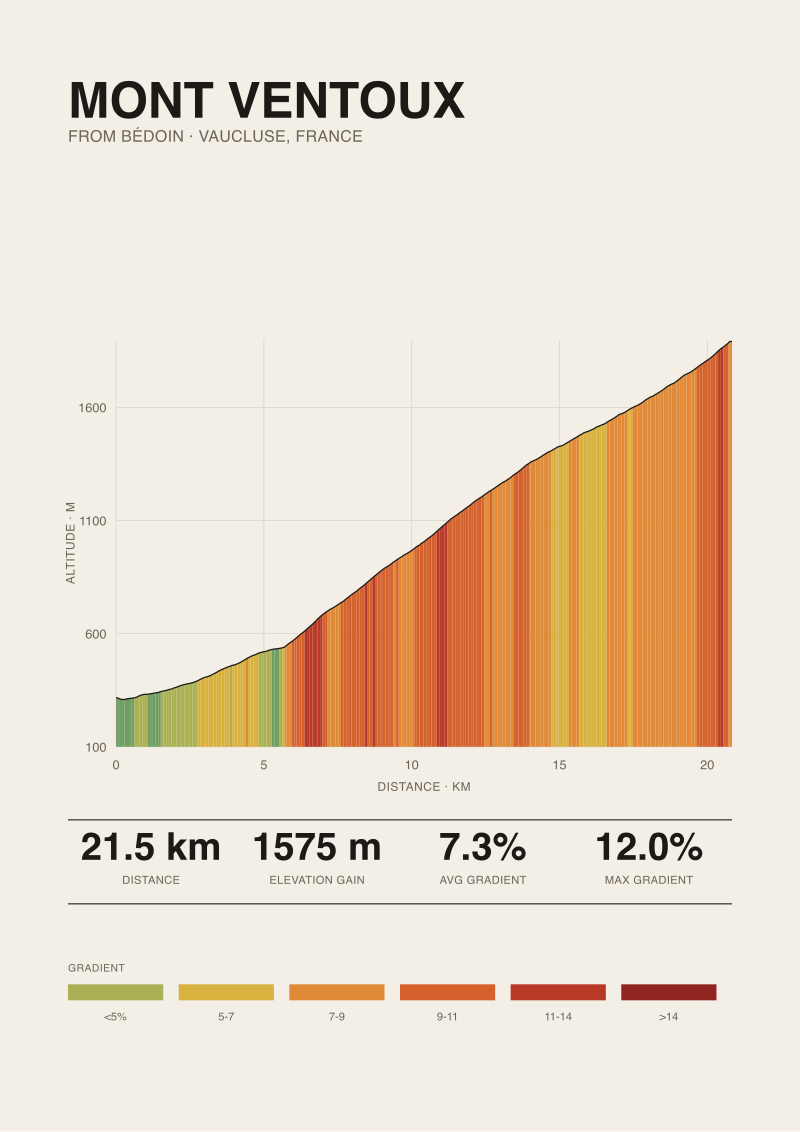
Ventoux from Bédoin is 21.51 kilometres, 1,575 metres of gain, 7.3 percent average, summit 1,892 metres, base at 317 metres. On the raw numbers, the average gradient matches the Stelvio exactly. Two identical prints? No. And this is where naive "top climbs" wall art fails hardest.
Ventoux's profile has a structural break the Stelvio does not have. The lower 6 kilometres through the Forêt du Bédoin sit at a moderate gradient; the road then hits Chalet Reynard and enters the lunar section — the exposed limestone above the treeline — and the character of the climb reverses. Published maximum is 12 percent (climbfinder). Our SRTM sample softens that, again as expected at 30m resolution, but the profile shape still shows the inflection: a long, wooded ramp giving way to a shorter, more brutal open segment.
A print of Ventoux that hides that inflection is a print of a mountain nobody has ever ridden. The reason this climb earns wall space in a training room is precisely that the profile does storytelling work without a legend. A rider looking up between intervals sees the tree line, the observatory pitch, the top third that is what the climb is actually remembered for. If the print is drawn as a smooth 7.3 percent slope with a peak on the right, the studio has thrown away the only interesting information the geometry contains. Ventoux's average gradient is a lie the profile corrects. Buy the print that corrects it.
Finding #3: The Tourmalet Reads Flatter Than It Rides
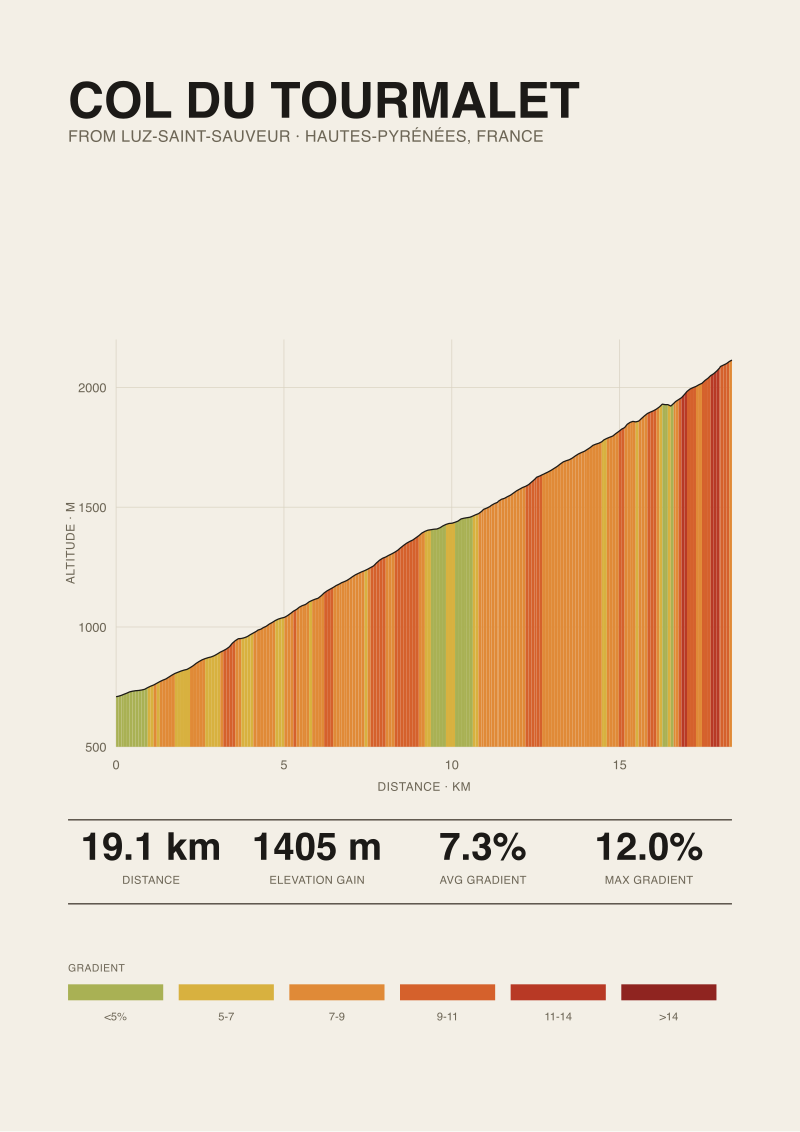
The Tourmalet from Luz-Saint-Sauveur measures 19.12 kilometres with 1,405 metres of gain, averaging 7.3 percent to a summit at 2,114 metres from a base of 709 metres. Climbfinder's published maximum is 12 percent. The three climbs discussed so far all share the same 7.3 percent average, which is the first honest reason to be sceptical of averages as a print-selection criterion.
What separates the Tourmalet visually is the base elevation and the total gain. At 1,405 metres, this is the lowest vertical delta of the four climbs in our set. On a wall where prints are hung at consistent vertical scale, the Tourmalet occupies less paper than the Stelvio by 435 metres of drawn height — roughly a quarter shorter in the vertical dimension of the print itself. That matters because most poster shops normalise every climb to the same box, which flattens the geographic hierarchy of the sport. A Tourmalet drawn the same "size" as a Stelvio tells the wall a lie about which mountain is bigger.
There is also the road itself. The Luz side is characterised by a consistent, ridable gradient without the hairpin architecture of the Stelvio and without the tree-line drama of Ventoux. That makes it the hardest of the four to render well as a print. A profile with no strong inflection asks the studio to justify the print through the accuracy of the drawing rather than through a visual hook. If you already know the Tourmalet — if you have ridden it, or you love the Pyrenees for their own reasons — it earns its place. If you are choosing wall art by drama alone, this is the one that will disappoint compared to the others.
 Col du Tourmalet
The print from this article · from €29.95
View the print →
Col du Tourmalet
The print from this article · from €29.95
View the print →
Finding #4: The Gavia Is Where Published Numbers and Our Data Diverge
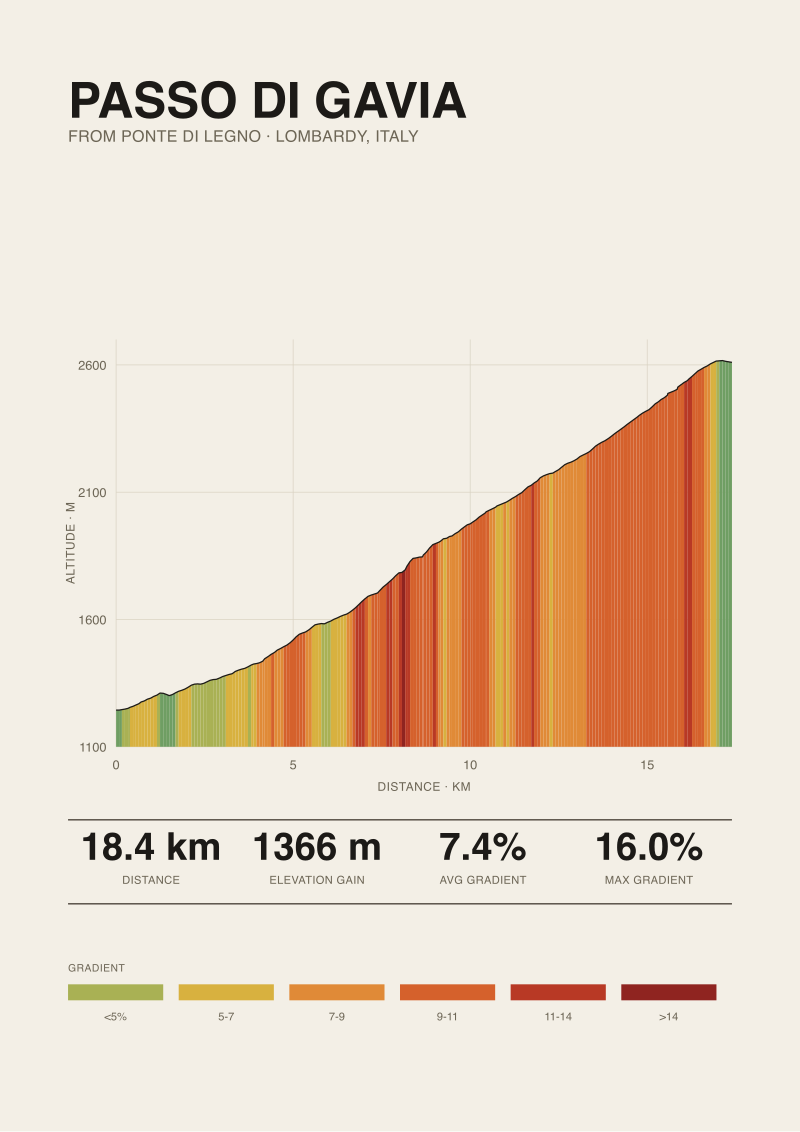
The Gavia from Ponte di Legno is 18.42 kilometres and 1,366 metres of gain at 7.4 percent average, base 1,244 metres, summit 2,610 metres. The climbfinder figure for maximum gradient is 16 percent. That published maximum is the highest in our four-climb set by a clear margin, and it is also the one where SRTM 30m elevation data is most obviously going to under-report reality.
We think this openly. A 16 percent pitch on a mountain road is often confined to a few dozen metres of hairpin exit, which is exactly the scale that 30-metre horizontal sampling cannot resolve — the ramp is shorter than the sample interval. Our own profile of the Gavia therefore shows a climb whose maximum gradient appears more moderate than a rider who has been dropped by their group on the steepest ramps will remember it. The published road-book number is more faithful to lived experience on that specific pitch. Our profile is more faithful to the road's overall shape.
For a print, this matters. A Gavia drawn from raw satellite elevation, without any annotation of the published maximum, will read as a slightly less severe climb than the Stelvio. In truth, the Gavia's reputation — the 1988 Giro stage, the narrow road, the exposure — comes from short ramps that our data smooths. We annotate the published maximum on the print for exactly this reason. The alternative is to overdraw the profile, which we will not do. The print shows what we measured; the caption shows what climbfinder publishes. Both numbers are true; they are answering different questions.
The Four Climbs, Side by Side
The comparison table below uses only measured and cited figures. Vertical gain is the axis that most determines how a print occupies wall space at consistent scale. Maximum gradient is split because the two sources disagree in known ways.
| Climb | Length (km) | Vertical Gain (m) | Avg Gradient (%) | Max Gradient — Published (%) |
|---|---|---|---|---|
| Passo dello Stelvio (Prato) | 25.04 | 1,840 | 7.3 | 14.0 |
| Mont Ventoux (Bédoin) | 21.51 | 1,575 | 7.3 | 12.0 |
| Col du Tourmalet (Luz) | 19.12 | 1,405 | 7.3 | 12.0 |
| Passo di Gavia (Ponte di Legno) | 18.42 | 1,366 | 7.4 | 16.0 |
Three of the four climbs share the same average gradient to one decimal place. That should end any conversation in which average gradient is used as a proxy for print-worthiness. What distinguishes them is total vertical gain, base elevation, profile shape, and the honesty of the source about its maximum. Published maxima come from climbfinder.com in every row; our own profile data is OpenTopoData SRTM 30m throughout.
What This Does NOT Prove
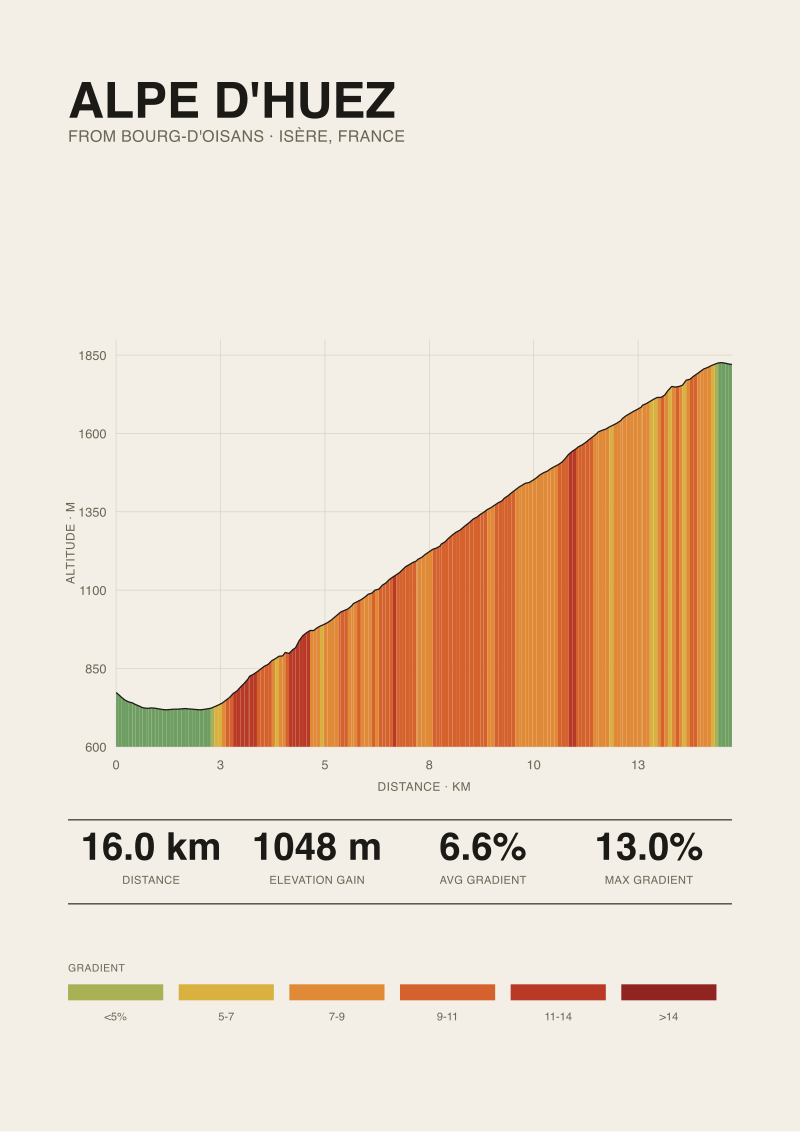
This audit is a print-selection argument, not a ranking of climbs by difficulty or historical importance. The four climbs here are the four in our current grounding set; there are other paved climbs — the Angliru, the Zoncolan, Alpe d'Huez, the Mortirolo — with legitimate claims to any home gym wall. Their absence here is not a verdict.
We are also not claiming that our SRTM 30m profiles are a substitute for lived road knowledge. On the Gavia specifically, we know our maximum gradient reads lower than what a rider feels on the steepest exit ramps, and we have said so. A print built from satellite elevation is faithful to overall shape and cumulative gain; it will smooth pitches shorter than the sample interval. Anyone selling a cycling climb print that claims spike-accurate maximum gradient from any satellite-derived dataset is either using higher-resolution proprietary lidar or overstating what their data can support. If you need pitch-accurate max, ask what dataset produced the number. If the answer is "SRTM 30m", the honest add is a cited road-book maximum alongside.
The Takeaway
Buy the print because you know the climb, or because the profile — drawn honestly to real elevation data — earns its place above your trainer on the merits of the road, not the mythology. Our four measured climbs are in the shop; the numbers in this audit are the numbers on the wall.
FAQ
Which of these four climbs works best above a turbo trainer?
The Stelvio from Prato allo Stelvio, on strict arithmetic. Its 1,840 metres of measured vertical gain gives the print the most visible presence at consistent vertical scale, and the 48-hairpin architecture translates into a profile that reads as clearly geometric rather than as a generic upward slope. Ventoux is the strongest second choice because its treeline inflection above Chalet Reynard produces a break in the profile that carries visual information across a room, which matters when you are only glancing at the wall between intervals.
Why do three of the four climbs have the same 7.3 percent average gradient?
Because average gradient is a low-resolution summary of a road that hides almost everything interesting about how it climbs. Stelvio, Ventoux and Tourmalet all resolve to 7.3 percent from their canonical bases, yet they ride and read completely differently. The Stelvio holds its gradient inside tight switchback bands; Ventoux breaks in character at the treeline; the Tourmalet climbs on a long consistent ramp. Average gradient tells you almost nothing about which one belongs on your wall. Vertical gain and profile shape tell you almost everything.
What is the difference between your measured maximum gradient and the "published" one?
Our maximum comes from sampling OpenTopoData SRTM 30m elevation along the road line, which under-reads short, sharp pitches because the sampling interval is coarser than the ramp length. The published maximum in each entry above comes from climbfinder.com, which cites road-book gradients that reflect on-road measurement of the steepest sections. On the Gavia this gap is largest — we show a smoother profile than the 16 percent published max would suggest. We publish both figures rather than pick the flattering one.
Do you sell prints of climbs that are not in this audit?
The studio's shop carries the climbs we have measured and drawn to our standard. This audit uses four canonical ascents from the current grounding set — Stelvio from Prato allo Stelvio, Ventoux from Bédoin, Tourmalet from Luz-Saint-Sauveur, Gavia from Ponte di Legno. Other paved climbs across the Alps, Pyrenees, Dolomites, Asturias and Mallorca have measurable profiles we consider worth drawing. If a specific climb matters to you and it is not visible, check the shop directly rather than assuming it does not exist.
Should I choose a print by the climb I have ridden or by the one I want to ride?
Both work, for different reasons. A print of a climb you have ridden earns its place through memory: the profile is a compressed record of a day the rider owns. A print of a climb you want to ride does different work — it sits above the trainer as a specific object of intent, which is more useful than a generic "cycling" poster. What does not work is choosing by silhouette or drama alone. The Tourmalet is the least visually dramatic of these four and will disappoint on the wall unless you already have a reason to want it there.
How is a profile print different from the cycling wall art in most bike shops?
Most bike-shop wall art is decorative silhouette — a mountain shape sourced from stock imagery, sometimes traced from a marketing photograph, with no relationship to the actual road profile of the climb it names. A profile print is drawn from the road's elevation along its length, at consistent horizontal and vertical scale, so the drawing itself carries the climb's real geometry. The test is simple: ask what elevation dataset produced the drawing. If there is no answer, it is decoration with a place name on it.
Why isn't Alpe d'Huez in this audit?
It is not in the grounding set this audit was built from. The four climbs analysed here — Stelvio, Ventoux, Tourmalet, Gavia — are the four we had measured profile data for at the time of writing. Alpe d'Huez, the Mortirolo, Angliru, Zoncolan and other legitimate wall-worthy climbs will get their own audits when their profiles enter the same measurement pipeline. The absence here is a scope decision, not an editorial one, and we would rather say so than fabricate figures to cover a gap.
From the collection
New climbs and 10% off your first print.
One email now with your code. No noise after.